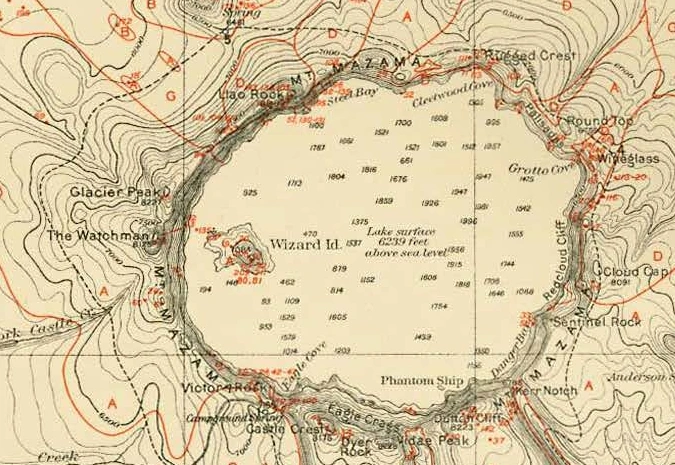
Find the little island near the left shore of this Oregon map. Set a fingertip on it and move west. In the space of a fingernail you can come down a volcanic cone, cross open water, and climb a wall steep enough that the mapmaker could barely fit the lines between the shore and the top. The page under your finger hasn’t changed height once.
The island is Wizard Island. The wall belongs to the basin that holds Crater Lake. The map appeared in a U.S. Geological Survey report in 1902, and it has a small trap for anyone who reads the numbers before reading the words. A number on the water can mean two quite different things. You can sort them out from the sheet itself.
Start with the shoreline
Imagine a pencil fixed to the bow of a boat at water level. If you could run it around every bay and headland, it would draw a wonderfully crooked line, and every point along it would have one thing in common. Each would be at the height of the lake. That’s a contour you can recognize without knowing a single map symbol.
Now imagine raising the water. Where the wall is steep, the new shore would lie close to the old one. On gently rising ground, the same rise would carry the water some distance inland. Draw both shores seen from above and you have the beginnings of a topographic map. The surveyor can draw the next line on perfectly dry ground. All it takes, in principle, is a set of places at the same elevation.
Look just west of Wizard Island for the words The Watchman. Along the intervening shore the lines crowd into a dark band. Let your eye travel a little farther west and they open out into shapes you can follow individually. That difference tells you where the ground gains height fastest. It also explains why the shortest line you can draw between two places on a map may involve quite a climb.
Count the spaces
On a USGS topographic sheet, look in the margin for the contour interval. It gives the vertical step between neighboring regular contours. The heavier index lines carry elevations so you can pick up the count again after losing your place. The scale bar answers a different question: how far apart two places are across the ground in plan view. One measures up the hill, the other across the page.
Here’s an easy way to lose a whole interval. On a sheet with a 40-foot interval, suppose your pencil starts exactly on a line marked 6,000 feet. It climbs straight past the next two regular contours and stops on the third. Four lines have touched the pencil, including the one it started on. How much height has it gained?
Check the climb
Start on the 6,000-foot line. Count each gap you cross on the way uphill.
A closed loop takes a little more care. On an ordinary hill, follow the heights inward and they rise. A closed depression can carry short ticks pointing toward the lower ground. Wizard Island offers a particularly good reason to look twice. The island rises above the lake, and its summit holds a small crater. A map can put a hollow on top of a hill. Whether a particular sheet has enough detail to draw both is another question.
Try reading two closed loops on a Kentucky map. One walk takes you ten feet uphill and the other ten feet down. Which would you pick for the hollow?
On that same Kentucky sheet, a little black cross gives the height of a spot small enough to rest a survey rod on. Match the surveyor’s field note to one of two railroad crossings.
Two kinds of feet
Go back to the pale patch in the middle of the map. Most of the figures stand alone. One has a sentence attached. The plate gives the lake surface as 6,239 feet above sea level. Read that as the figure on the historical plate. The scattered numbers in the water are depths. One measurement starts at sea level and goes up to the boat. The other starts at the boat and goes down.
The distinction cost somebody a good deal of rowing. In 1886, Clarence Dutton’s party took a lead weight and piano wire onto Crater Lake and made 168 soundings. A sounding belongs to the spot where the crew lowered the weight. Between two such spots lies a stretch of bottom the wire never touched. A tidy printed number gives little hint of all the water around it that still had to be crossed.
In 1959 a sonar survey took more than 4,000 soundings. With enough measurements to contour the bottom, a submerged cone called Merriam Cone came into view on the map. Wizard Island gives itself away to anybody standing on the rim. Its underwater neighbor had to wait for a denser set of observations. Even a good map has a grain to it: some things are small enough, or fall far enough between observations, to disappear.
Where would the water go?
Try the rim once more. Picture a drop landing on the slope just inside the western wall, then another landing on the far side of the crest. Give each a downhill route. The inner slope leads toward the lake. The outer slope sends water away from it. A narrow ridge on paper divides two quite different destinations.
Now try to draw the lake’s outlet. Follow the shore all the way around. It is tempting to choose the lowest-looking notch and send a stream through it. The National Park Service supplies the detail that the paper exercise can’t: Crater Lake has no surface outlet. Water leaves through evaporation and seepage. A contour can take you down to the water’s edge. It takes other evidence to follow the water into the rock.
The last place worth visiting is outside the map’s border. The margin credits Mark B. Kerr with the topography and dates the survey to 1886. A little dashed line in the key marks a possible route for a pack train; the accompanying words warn that there was no trail. Imagine packing for that journey after looking only at the dashes. Then look back at the lake. The difference between an elevation and a sounding, or a trail and somebody’s idea of where one might go, can be a handful of words in small type.
On a Virginia map, the small print answers a different question. Why did the mapmaker draw the new streets in purple? Find the little dead end above Cabin Branch, then see what the margin says about how it got there.